


 56-57 / 111

4.1.4.
Energy Efficiency and Carbon Dioxide Emissions
The increase in the number and type of services, the
growth in consumer traffic and the expansion of coverage
areprocesses relatedtotheconstructionandmaintenance
of infrastructure that consumes significant amounts of
energy. More than half of the energy needed for our users
to take advantage of mobile or fixed services is consumed
inournetworkanddata centres. Our constant striving is to
increase their efficiency and achieve optimal consumption
in relation to the growth of our business.
In 2018, the energy consumption for our mobile network
grew to 42 GWh, and its share in total electricity
consumption increased to 34%. Compared to the past
two years, the mobile network represented 25% of our
electricity consumption in 2016 and 28% in 2017. The
growth trend is fullyexpected in light of increase ofmobile
service consumption and speed and reliability quality that
we support. The electricity consumption of the mobile
network is mainly limited to DTX and power control
functions that are enabled for 100% of the network.
Another significant consumer of electricity is cooling. In
addition to the standard technical solution, such as free
cooling systems, we allow higher operating temperatures
for telecommunication equipment and only place the
batteries in a cooling container.
Main consumer of electricity remains the fixed network,
which in2018registeredaconsumptionof74GWh.Wepay
special attention to optimizations in this type of network.
Although last year our consumer reach continued to
increase, wemanaged to reduce consumption by 1.4 GWh.
During the year, we made a number of improvements to
fixed telephony. We transfer subscribers to more energy-
efficient facilities based on NGN technology and take out
TDM technology from use. This allowed us to close 17 old-
style telephone exchanges in 2018.
The total energy consumption of VIVACOM in 2018 in the
form of electricity, heat and fuel is 150.3 GWh. Compared
to 2017, there was a total increase of 4%. For VIVACOM
investments in energy efficiency are an integral part of
the business. The solutions are not self-directed, but are
based on a detailed analysis of the return on each case
and technology.
In 2018, the energy consumed byVIVACOMgenerates 69.1
thousand tons of carbon emissions (direct and indirect),
a 6% increase from 2017. If we add NURTS energy
consumption, the total carbon footprint is 80.9 thousand
tons.
Over the past few years, we have been taking steps to
seek alternative energy sources through tests for power
supply base stations with RES. Several of our sites have
photovoltaic cells installed, but so far the results do not
bring the required efficiency. However, we continue our
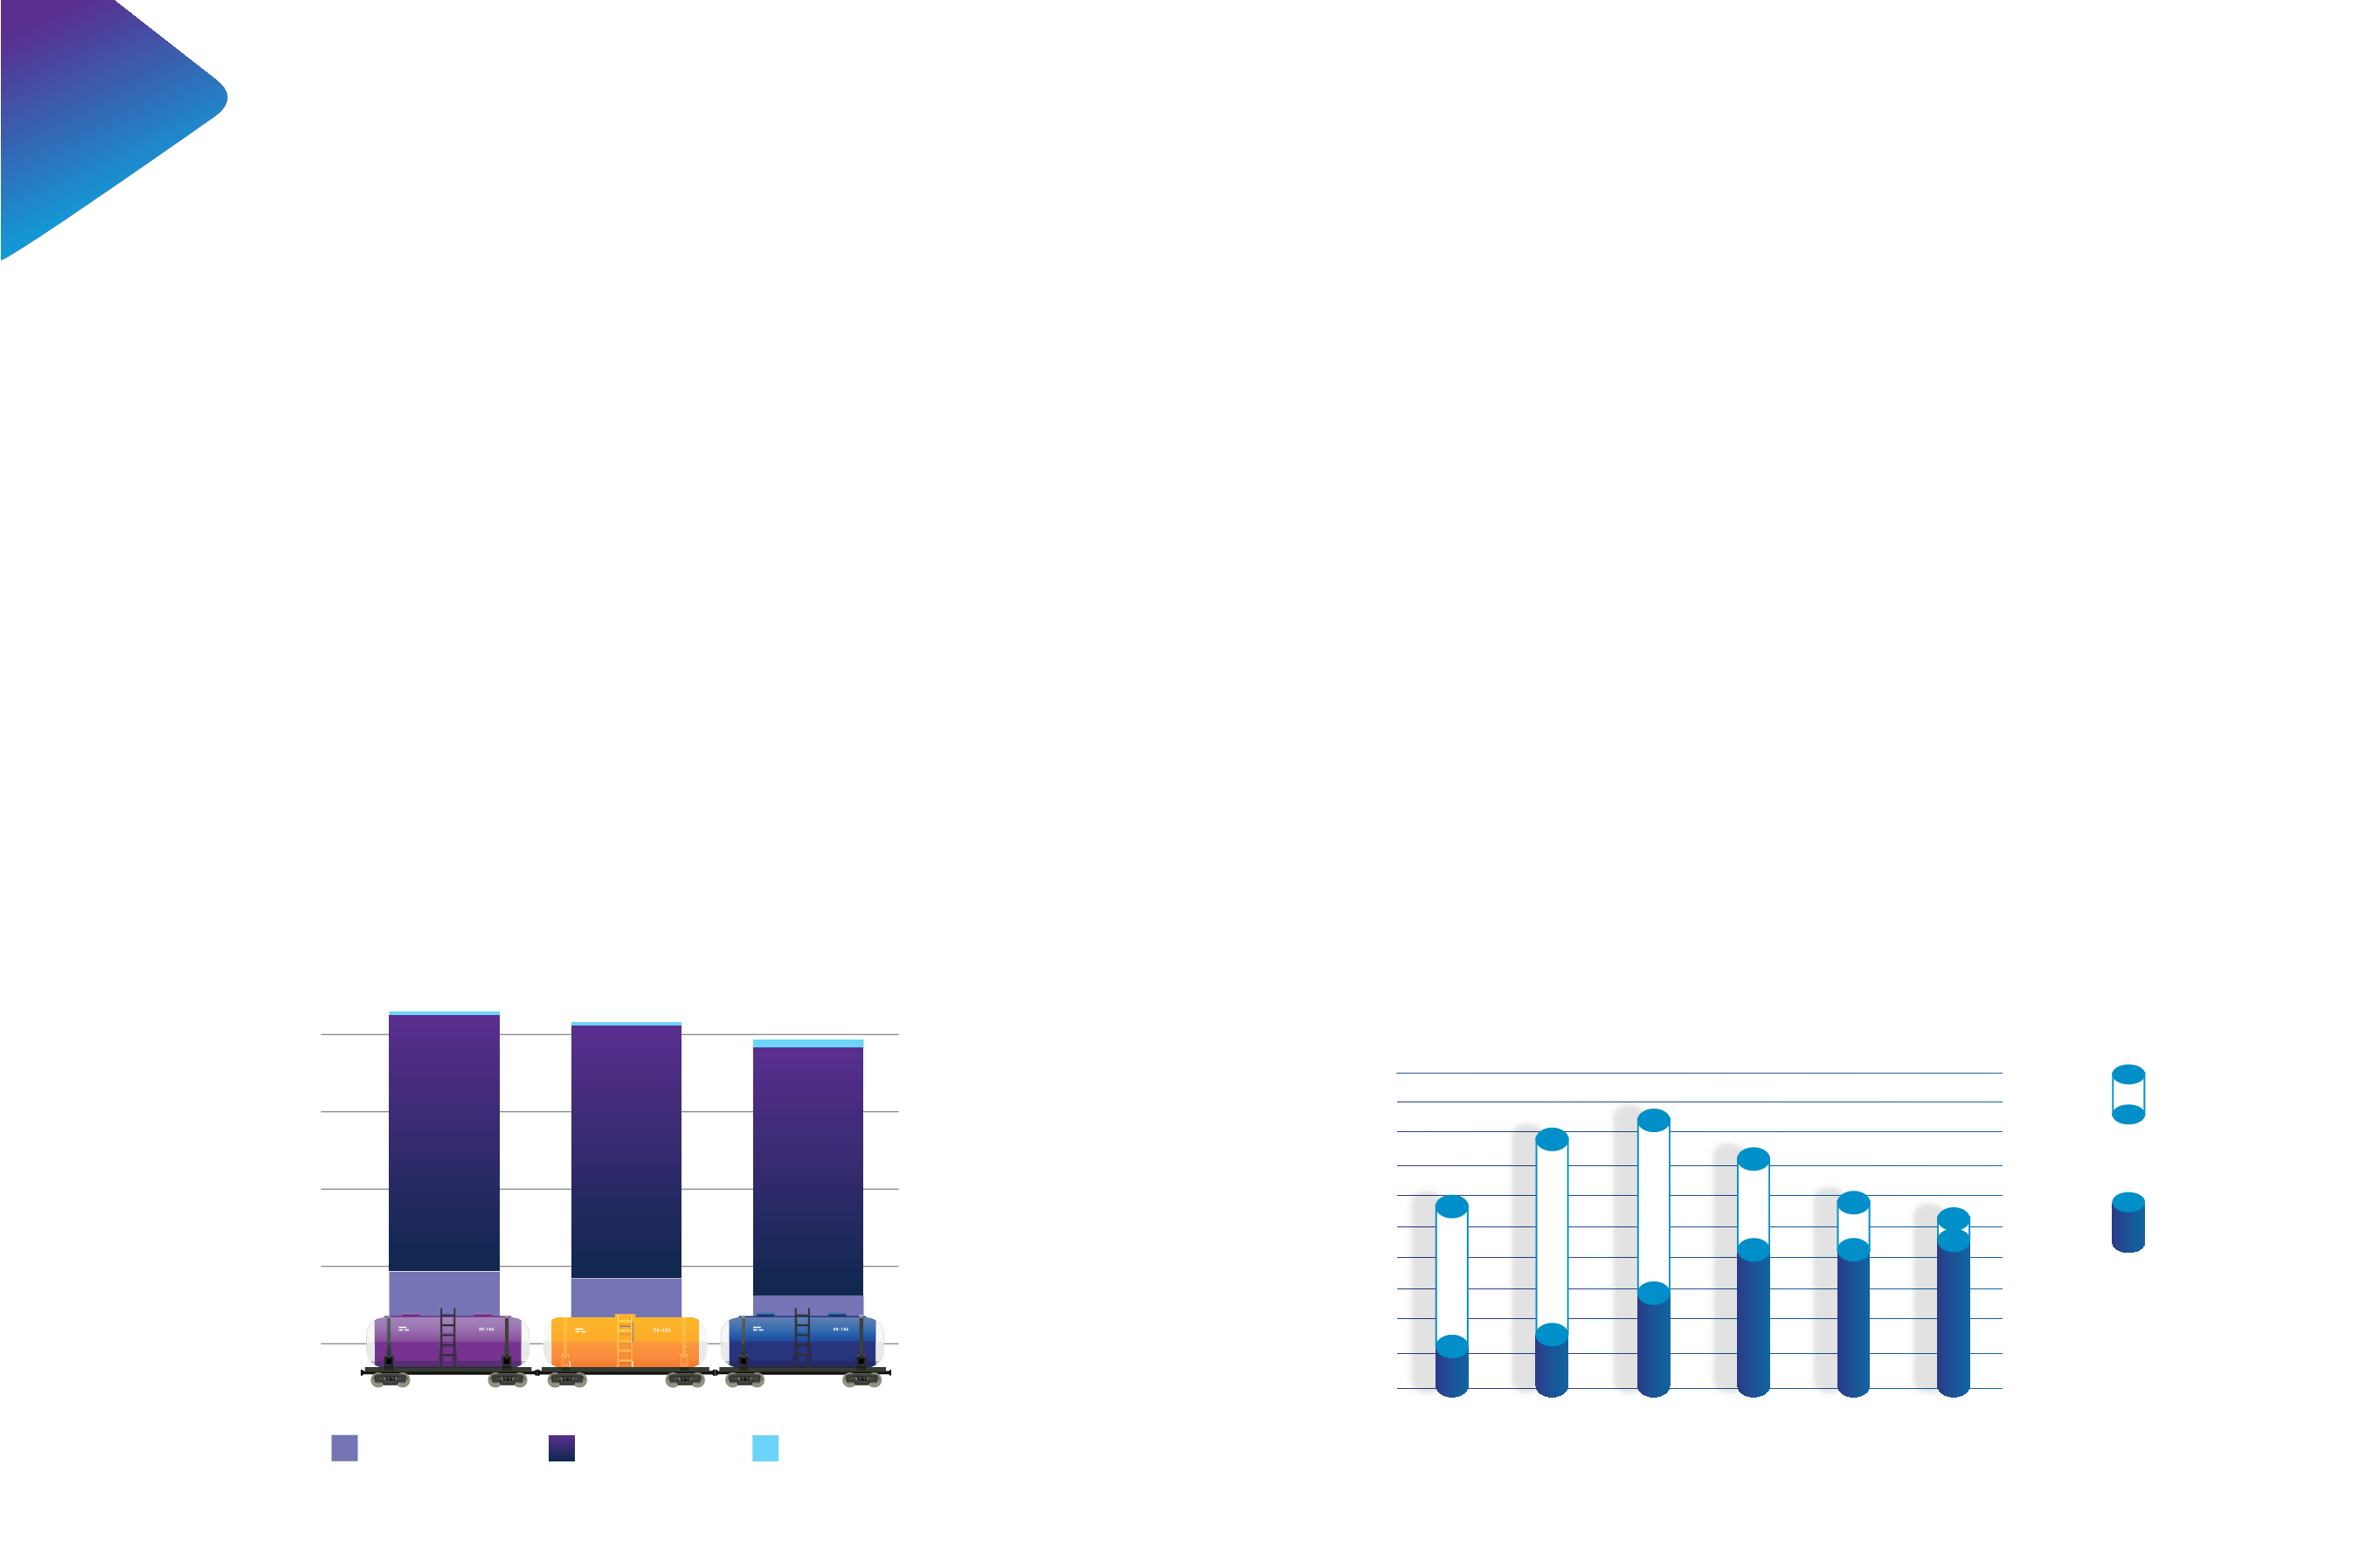
2016
500 000
0
1 000 000
1 500 000
2 000 000
2017
2018
Gasoline consumption
Diesel consumption
LPG consumption
4.1.5.
Circular Economy – Waste Management
As a large business, with a range of services and
infrastructure practically all across the country,
VIVACOM has the important task of optimally
managing the waste generated by its operations.
All our operating points have a significant amount
of electronic equipment that has a certain life cycle
and its end should be adequately planned. We strive
to minimize the amount of waste to be deposited of
and maximize the amount of equipment receiving a
second life via reuse or recycling.
In 2018, 278 tonnes of telecom equipment was taken
out of use and handed over for recycling. In addition,
we re-used 181,197 items or 41% of all equipment we
provide to end users.
Our fixed network also undergoes regular updates, which
in 2018 generated 561 tonnes of cables sent for recycling.
We continue to make efforts to reduce paper invoices
issued and encourage our customers to switch to
electronic ones. The issue of paper invoices is related
to paper consumption, document transport to address,
human resource for delivery, all of which can be
replaced by an electronic message. Every year, more
and more subscribers are aware of the importance of
such optimization and switch to an electronic invoice.
In 2018, there were 814,624 or 46% of all invoices
issued. As a result, our consumption of copier paper
decreases for another year, reaching 50,457 packages
for 2018.
Consumption of paper and share of electronic invoices
100 000
90 000
80 000
70 000
60 000
50 000
40 000
30 000
20 000
10 000
0
100%
90%
80%
70%
60%
50%
40%
30%
20%
10%
0%
Copy paper
Share of
electronic
invoices
2013
2014
2015
2016
2017
2018
ANNUALREPORT
2018
INTEGRATED
4. PERFORMANCE
4.1. Effective
efforts to develop projects and seek opportunities to
integrate such solutions.
To be as close to our customers as possible and to provide
them with the expected high level of service, our sales
representatives and technical teams travel daily between
different locations. Our fleet consists of 1,401 vehicles,
mostly diesel, gasoline, several LPG and 31 hybrids from
the last year, 20more than the previous one. An important
task is to optimize the travels and routes of our employees.
This allows us to reduce fuel consumption and air pollutant
emissions, especially in an urban environment where it is
most needed. Especially for the management of the cars
used by the technical teams, we use a software system to
maximize the timetable for visits to end-users and choose
the best routes for their completion. This saves resources
and reduces the carbon footprint of the company.
56
57